Graphical Analysis Demo v.3 4
Advertisement
Description
Graphical Analysis 3 arrives as an easy to use program that produces, analyzes and prints graphs that you make. It's been a popular product for years and with this third version new features and capabilities are included as well as an updated look.
Graphical Analysis 3 can do a lot of things. Create and print graphs, data tables, text, FFTs, and histograms. They are highly customizable; allowing you to perform automatic curve fits,...
Read more
- Rate:
- Release Date:01/26/2011
- License:Shareware
- Category:Utilities
- Developer:Vernier Software & Technology
- Downloads:1993
- Size:7.85 Mb
- Price: $80.00
To free download a trial version of Graphical Analysis Demo, click here
To buy software Graphical Analysis Demo, click here
To visit developer homepage of Graphical Analysis Demo, click here
Advertisement
System Requirements
Graphical Analysis Demo requires Windows.
Graphical Analysis Demo v.3 4 Copyright
Shareware Junction periodically updates pricing and software information of Graphical Analysis Demo v.3 4 full version from the publisher using pad file and submit from users. Software piracy is theft, Using crack, password, serial numbers, registration codes, key generators, cd key, hacks is illegal and prevent future development of Graphical Analysis Demo v.3 4 Edition. Download links are directly from our publisher sites. Links Graphical Analysis Demo v.3 4 from Bittorrent, mediafire.com, uploadfiles.com, hotfiles.com rapidshare.com, megaupload.com, netload.in, storage.to, depositfiles.com and other files hosting are not allowed. The download file is obtained directly from the publisher, not from any Peer to Peer file sharing applications such as Shareaza, Limewire, Kazaa, Imesh, eDonkey, eMule, Ares, BearShare, Overnet, Morpheus, BitTorrent Azureus and WinMX.
Review This Software
More Graphical Analysis Demo Software
Advertisement
Graphical Analysis v.3.4
Graphical Analysis is an inexpensive, easy-to-learn software for producing, analyzing, and printing graphs. It has been one of our most popular products for years and now it's even better! We have rewritten Graphical Analysis, adding new features and

Fast Statistics for Excel v.2.0.3
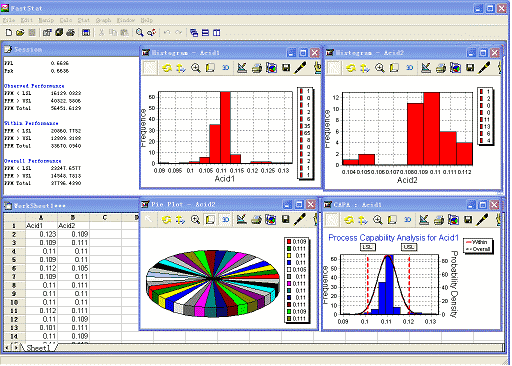
Fast Statistics is an easy to use Statistical and Graphical Analysis tool for MS Excel , it can work as an Excel add-in, perform from basic data manipulations to the most advanced statistical analyses and produce sophisticated reports and charts.
VisIT v.4 22
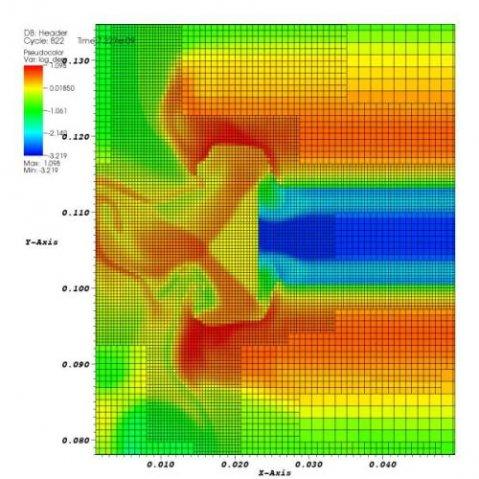
VisIt is a free interactive parallel visualization and graphical analysis tool for viewing scientific data on Unix and PC platforms. VisIt contains a rich set of visualization features so that you can view your data in a variety of ways.
ProcessMA v.1 6
ProcessMA is a Statistical Analysis tool.
Fast Statistics v.2.0.4
Fast Statistics is a statistical analysis program for Microsoft Excel. It is can be used as an add-on for it and also it can be installed as a stand-alone application, so there is no need to have MS-Excel installed.

ITLocus Charting v.1. 4. 2015
IT Locus Charting is an advanced charting application for graphical analysis of financial and stock market. It supports any number of windows with an arbitrary number of charts of stocks, futures, mutual funds or indices in each of them. The list of
BioStat 2008 v.5 5
BioStat - user-friendly biology and medicine oriented statistical software. With BioStat 2008, one gets a robust suite of statistics tools and graphical analysis methods that are easily accessed though a simple and straightforward interface.
BioStat 2007 v.3. 8. 2004
BioStat - user-friendly biology and medicine oriented statistical software. With BioStat 2007, one gets a robust suite of statistics tools and graphical analysis methods that are easily accessed though a simple and straightforward interface.

The VisIt Visualization System v.3
VisIt is an interactive parallel visualization and graphical analysis tool for viewing scientific data.
MVPstats v.23. 2. 2011
MVPstats has been created to assist the industrial researcher in conducting statistical analysis.
CANgraph v.9.0
CANgraph is a convenient tool for efficiently evaluating measurement files of all types offline. Measurement data acquired in network development, analysis and ECU calibration may be read-in from various formats and further processed.
Other products of this developer Vernier Software & Technology
LabQuest Emulator v.1 5
The LabQuest Emulator is a free simulated versio...oftware or project onto a screen for your class.
Logger Lite v.5.0
Logger Lite makes collecting science and math da...ng more intuitive by making science more visual.